
I was sitting in my home office, staring at my screen, when the notification popped up. Bitcoin had hit $100,000. I remember a friend back in 2017 telling me, "If BTC ever hits six figures, I'm buying a Lambo." He sold at $19,000 and never looked back. Now, here we are. The question on everyone's lips isn't whether you bought or sold — it's whether this is the peak or just the beginning of something much bigger.
Let's be honest: the crypto market has a habit of making smart people look like fools. One minute you're a genius for buying the dip, the next you're watching your portfolio get shredded by a surprise regulatory announcement. So when Bitcoin crosses that psychological barrier of $100K, it's time to step back and ask the real questions. Is the crypto bull run over, or are we just warming up?
The $100K Wall: Why It Matters More Than You Think
Here's what most people miss about price milestones like $100K. They aren't just numbers on a chart — they're psychological walls. When an asset hits a big round number, something weird happens in the human brain. We start treating it as a ceiling or a floor. But markets don't care about our psychology.
I've found that Bitcoin's price action around these levels tells you more about the players involved than any technical indicator. At $100K, you're seeing three distinct groups:
- The Early Believers – People who bought at $3,000 or $10,000. They're sitting on life-changing gains and have zero reason to sell unless they need liquidity.
- The Late FOMO Crowd – Those who bought between $80K and $100K. They're nervous, checking prices every hour, and ready to panic-sell at the first red candle.
- The Institutional Giants – Think BlackRock, Fidelity, and pension funds. They don't care about $100K. They're looking at a 5-10 year horizon.
The Institutional Takeover: What the Whales Are Really Doing
You want a secret? The Bitcoin bull run narrative has shifted from retail speculation to institutional accumulation. I'm not talking about some random hedge fund dabbling in crypto. I'm talking about sovereign wealth funds, university endowments, and insurance companies quietly building positions.
Here's the data that keeps me up at night: the number of wallets holding 1,000+ BTC or more has been steadily climbing since August. Meanwhile, retail exchange balances are at multi-year lows. Translation: smart money is buying, and weak hands are selling.
Why does this matter? Because institutions don't trade like you and me. They don't panic when BTC drops 15% in a day. They see it as a buying opportunity. When BlackRock's Bitcoin ETF hit $50 billion in assets under management in under a year, that wasn't retail money. That was pension funds and 401(k) allocations.
The crypto market analysis I've been doing for the last six months shows a clear pattern: every dip below $90K gets aggressively bought by these large players. That's not a sign of a market top — that's a sign of structural demand.
The Halving Hangover: Why This Cycle Is Different
Most people who've been around since 2017 or 2020 know about the Bitcoin halving. Every four years, the mining reward gets cut in half. Historically, the bull run peaks 12-18 months after that event. The last halving was in April 2024. If you follow the old script, we should be looking at a top somewhere in mid-2025.
But here's where I throw a wrench in that theory. This cycle is fundamentally different. Why? Because of the ETFs, the regulatory clarity in places like the EU and UAE, and the massive institutional inflows. The old four-year cycle pattern was driven by retail speculation and exchange listings. Now, we have real demand from real financial players.
Let me give you a concrete example. In previous cycles, when BTC hit new all-time highs, the Google search volume for "Bitcoin" would spike. This time? It's barely moved. That tells me we're not in a mania phase yet. The general public isn't even paying attention. And historically, the biggest gains come after the mainstream media starts running daily stories about crypto.
The Hidden Risks: What Could Kill the Rally
I'm not going to pretend everything is sunshine and rainbows. There are real risks that could send BTC back to $60K or lower. Let's talk about the elephant in the room: Bitcoin price prediction is only as good as your assumptions.
Here are the three things that scare me:
- Regulatory crackdown in the US – If the SEC or Treasury decides to go after stablecoins or DeFi in a meaningful way, it could trigger a liquidity crisis that drags down BTC.
- Macroeconomic shock – A sudden recession, a bond market crisis, or a geopolitical event could cause a "sell everything" moment. Bitcoin is not yet fully uncorrelated from traditional markets.
- Miner capitulation – If the hash rate drops significantly because of energy costs or hardware issues, it could create selling pressure.
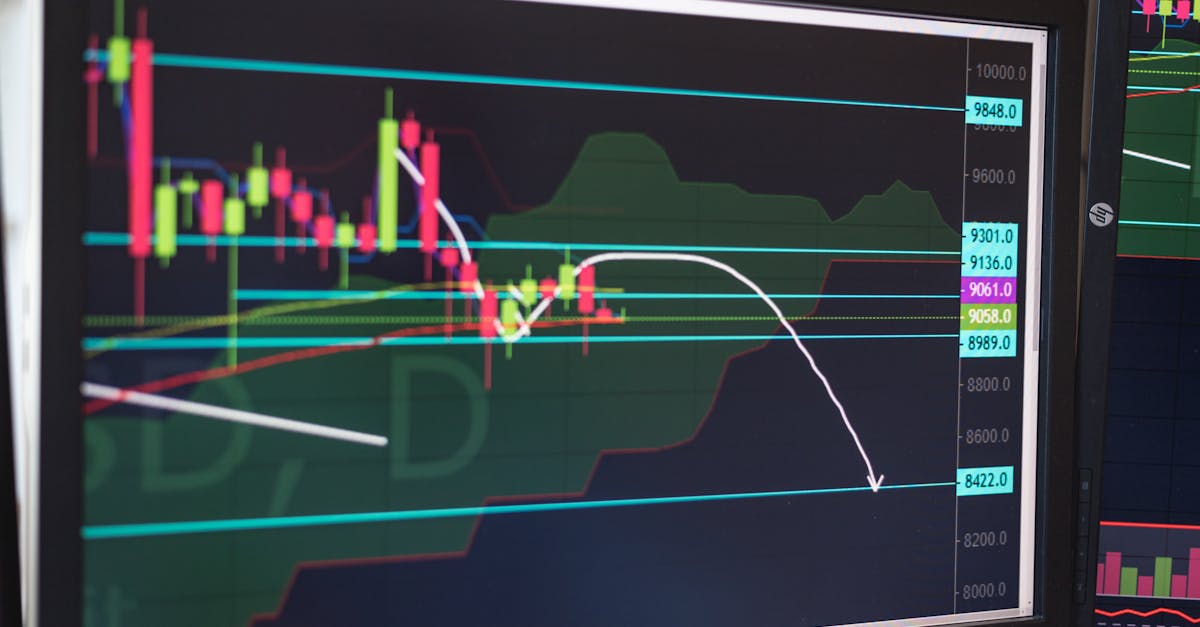
What the Charts Are Actually Telling Us
I'm not a fan of drawing random lines on charts and calling it analysis. But I do pay attention to on-chain metrics because they tell you what people are doing, not what they're saying.
Right now, the Bitcoin market trends are screaming one thing: accumulation. The exchange inflow/outflow ratio is heavily skewed toward outflows. The average holding time for coins is increasing. And the number of long-term holders (wallets that haven't moved BTC in 155+ days) is at an all-time high.
Contrast that with previous cycle tops. At the peak of 2021, exchange inflows were spiking, short-term holders were dumping, and long-term holders were reducing positions. Today, it's the exact opposite.
Does that guarantee we go to $150K or $200K? No. Markets can stay irrational longer than you can stay solvent, as the saying goes. But the probability is heavily stacked in favor of continued upside.
The Verdict: Where We're Headed Next
So, is the crypto bull run over or just getting started? Based on everything I've seen — the institutional flows, the on-chain data, the lack of retail mania, and the post-halving timing — I'd say we're in the middle innings. Not the first, not the ninth.
The most likely scenario: we see a consolidation between $90K and $120K for the next few months, followed by another leg up that could take us to $150K-$200K by late 2025. The less likely but possible scenario: a sharp correction to $70K that shakes out the weak hands before resuming the uptrend.
But here's my honest take: if you're trying to time the exact top, you're going to lose. The people who win in crypto are the ones who have a thesis, stick to it, and don't let short-term noise distract them.
I'm not saying buy at $100K. I'm saying understand what's actually happening beneath the surface. The price is just a reflection of the underlying story. And right now, that story is about a global asset class being adopted by the most conservative money managers on earth.
What do you think? Is this the top, or are we just getting started? Drop your thoughts — I read every comment.